
This comes from the file content/big_picture.Rmd.
Author: Liangxi Dou, Jialin Guo, Yutong Du and Jiaqi Yin.
Big Picture
Customers are always the most important element that all institutions providing service want to sustain and earn more. Churning rate representing the attrition rate, or the loss of clients for an institution.
As a result, investigating the underlying reason behind customer’s leaving is always a hot topic in every industry, including the banking industry. Moreover, domains like banks usually use churn analysis and churn rates as a key business metric. One reason is that the cost of retaining an existing customer is less than the cost of acquiring new customers. Another reason is this metric would reflect on the value of the bank and a better index could help them acquire more investment.
In this project, the purpose is to study what factors affect client churning and the characteristics of attrited customers. The dataset we used for analysis in this project is from the Kaggle.
Now, let’s go into the story of bank manager John from a local bank and explore the task he faced on customer churning together.
A local bank has currently met a condition that increasing customers are leaving their credit card service and choosing other banks’ service. As a result, this local bank asked the bank manager John to be responsible for this urgent case and figure out what reasons lead to this condition. This is a crucial task for John since successfully resolving it could help the local bank prevent more customers from leaving.
John’s upper level management gives him a dataset of customers including both existing customers and customers who choose to leave. This data set consists of 10,000 customers mentioning their age, salary, status marital, credit card limit, credit card category, etc.
The first thing that comes into John’s mind is to have a better understanding towards bank’s customers, despite whether they choose to stay or leave.
##                          vars    n    mean      sd  median trimmed     mad
## X1                          1 9228 4624.70 2678.95 4616.50 4616.50 3420.36
## Attrition_Flag*             2 9228    1.83    0.37    2.00    1.92    0.00
## Customer_Age                3 9228   46.45    7.99   46.00   46.45    8.90
## Gender*                     4 9228    1.46    0.50    1.00    1.45    0.00
## Dependent_count             5 9228    2.35    1.30    2.00    2.38    1.48
## Education_Level*            6 9228    4.08    1.84    4.00    4.11    1.48
## Marital_Status*             7 9228    2.46    0.74    2.00    2.45    1.48
## Income_Category*            8 9228    3.89    1.51    4.00    3.95    1.48
## Card_Category*              9 9228    1.14    0.62    1.00    1.00    0.00
## Months_on_book             10 9228   36.02    7.97   36.00   36.06    5.93
## Total_Relationship_Count   11 9228    3.95    1.50    4.00    4.03    1.48
## Months_Inactive_12_mon     12 9228    2.35    1.01    2.00    2.29    1.48
## Contacts_Count_12_mon      13 9228    2.47    1.12    3.00    2.48    1.48
## Credit_Limit               14 9228 8094.13 8711.45 4188.50 6167.77 3401.08
## Total_Revolving_Bal        15 9228 1147.08  817.64 1257.00 1129.15  891.78
## Avg_Open_To_Buy            16 9228 6947.04 8722.47 3125.00 5011.76 3498.94
## Total_Amt_Chng_Q4_Q1       17 9228    0.76    0.23    0.73    0.74    0.17
## Total_Trans_Amt            18 9228 3494.85 1673.79 3654.50 3371.02 1723.52
## Total_Trans_Ct             19 9228   60.91   20.08   65.00   61.54   23.72
## Total_Ct_Chng_Q4_Q1        20 9228    0.71    0.25    0.69    0.69    0.19
## Avg_Utilization_Ratio      21 9228    0.28    0.28    0.19    0.25    0.28
##                             min      max    range  skew kurtosis    se
## X1                          1.0 10126.00 10125.00  0.02    -1.17 27.89
## Attrition_Flag*             1.0     2.00     1.00 -1.79     1.20  0.00
## Customer_Age               26.0    68.00    42.00 -0.02    -0.28  0.08
## Gender*                     1.0     2.00     1.00  0.17    -1.97  0.01
## Dependent_count             0.0     5.00     5.00 -0.04    -0.68  0.01
## Education_Level*            1.0     7.00     6.00  0.15    -0.96  0.02
## Marital_Status*             1.0     4.00     3.00  0.13    -0.28  0.01
## Income_Category*            1.0     6.00     5.00 -0.41    -1.06  0.02
## Card_Category*              1.0     4.00     3.00  4.27    16.53  0.01
## Months_on_book             13.0    56.00    43.00 -0.08     0.40  0.08
## Total_Relationship_Count    1.0     6.00     5.00 -0.24    -0.89  0.02
## Months_Inactive_12_mon      0.0     6.00     6.00  0.63     1.10  0.01
## Contacts_Count_12_mon       0.0     6.00     6.00 -0.02    -0.01  0.01
## Credit_Limit             1438.3 34516.00 33077.70  1.79     2.37 90.69
## Total_Revolving_Bal         0.0  2517.00  2517.00 -0.12    -1.17  8.51
## Avg_Open_To_Buy             3.0 34516.00 34513.00  1.79     2.35 90.80
## Total_Amt_Chng_Q4_Q1        0.0     3.40     3.40  1.75     9.61  0.00
## Total_Trans_Amt           510.0  8614.00  8104.00  0.70     0.50 17.42
## Total_Trans_Ct             10.0   113.00   103.00 -0.26    -0.97  0.21
## Total_Ct_Chng_Q4_Q1         0.0     3.71     3.71  2.07    14.92  0.00
## Avg_Utilization_Ratio       0.0     1.00     1.00  0.65    -0.91  0.00
After generating the table above, the first thing that comes into John’s mind is that most of the customers are around 46 years old. Based on common sense, he believes that loyal customers might mostly come from older people. Since younger generations usually have less loyalty towards one service that they tend to try different options, John thinks they may easily churn. Based on this hypothesis, he made this graph below.
Customer_Age
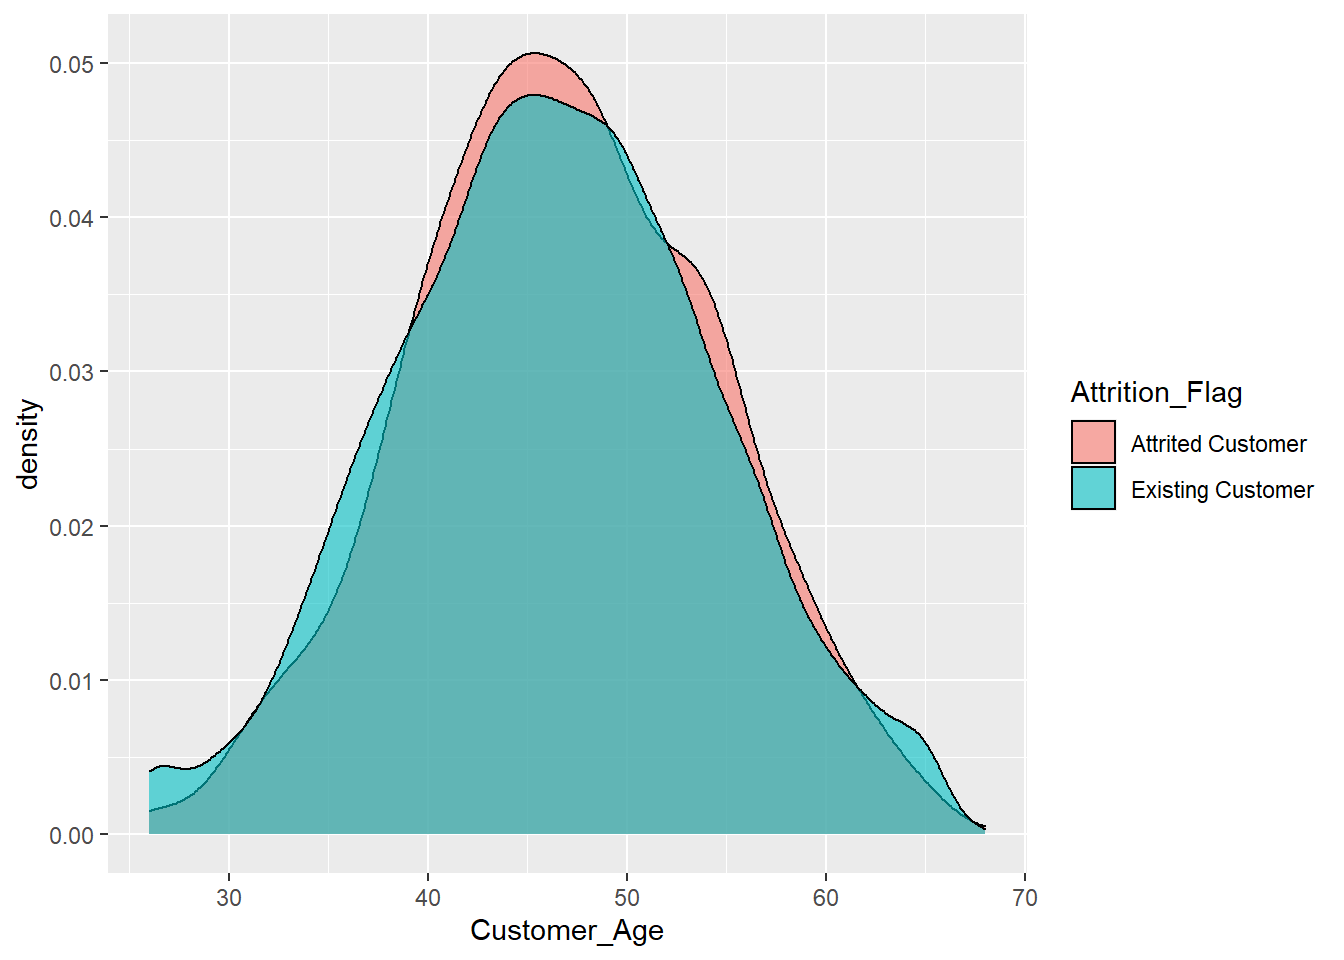 * However, after the result came out, John realized that there are no obvious differences between the proportion of customer’s churn based on customer’s age. Therefore, age is not an influential factor in customer churning.
- “If age doesn’t influence one’s loyalty towards our services, the times they used our card must show something!” John realized that people who used their credit card more frequently must show their satisfaction towards the service and thus less likely to leave.
Total transaction count
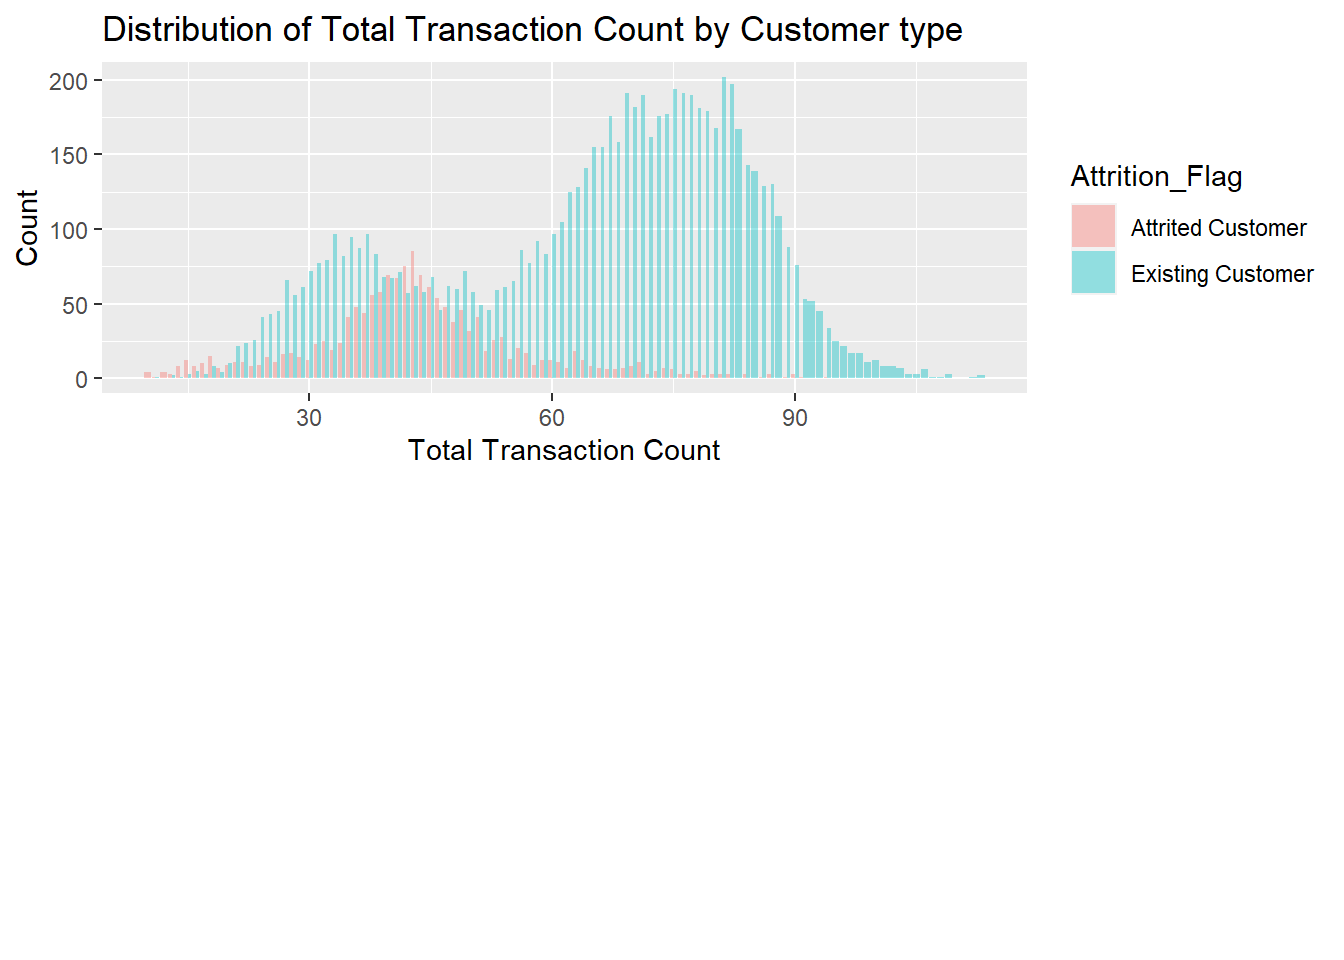 This time, John is right. Based on the graph above, we can see that for attrited customers tend to have much less total transaction count for the last 12 months.
However, John is a very cautious man. He wants to make sure that the high counts of transactions from existing customers wasn’t led by making less amounts of transactions each time. Moreover, he would also like to know if he could find some clusters from the customers.
## `geom_smooth()` using method = 'gam' and formula 'y ~ s(x, bs = "cs")'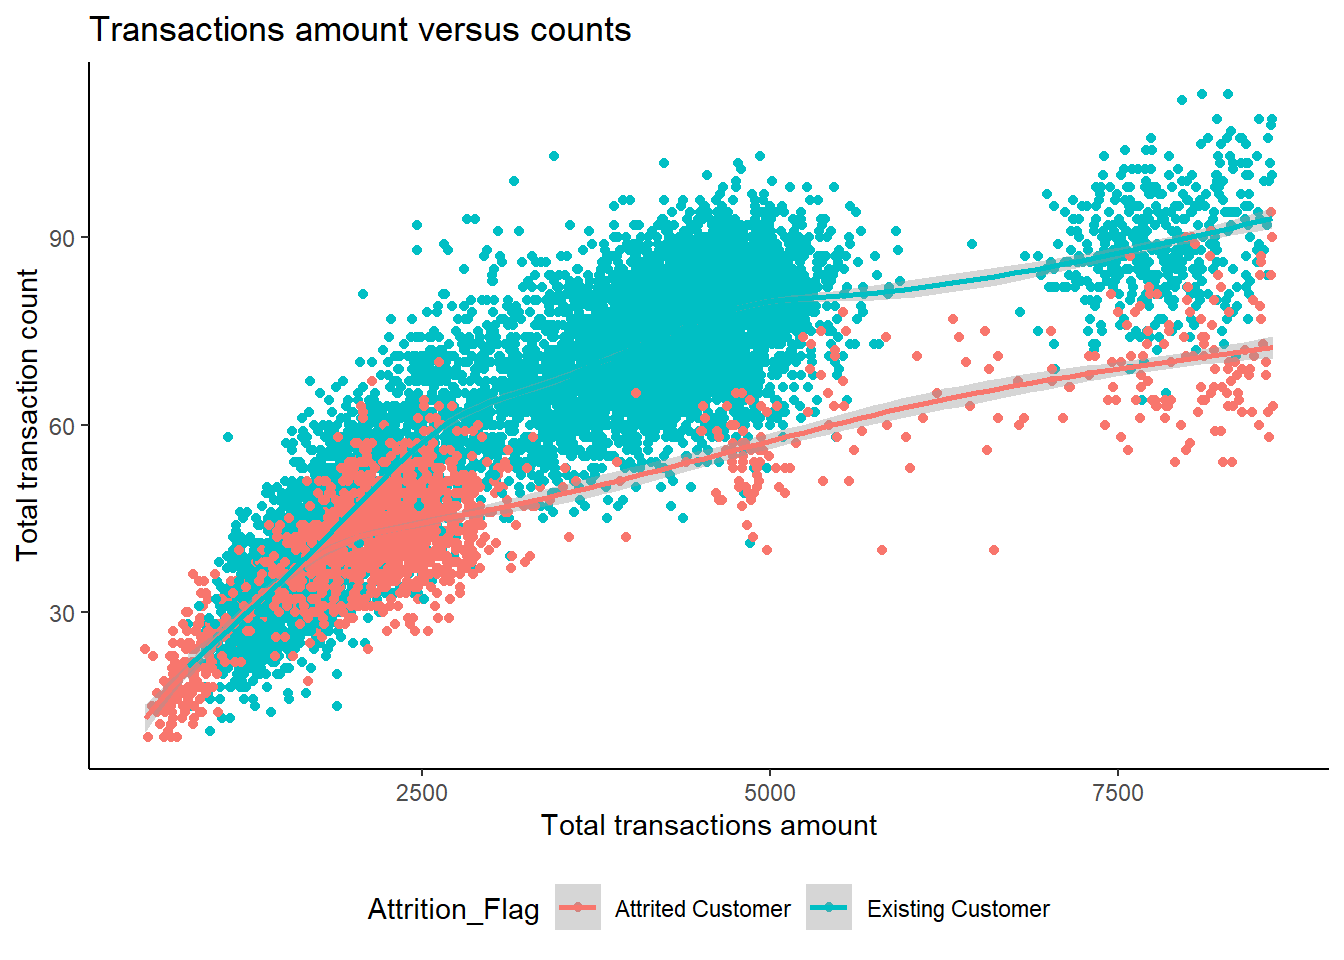 * From the graph above, John realized that there’s a group of people who would have much more transaction amount and transaction count than the other customers. Showing by the upper-left cluster, we can conclude that with around 15000 total transactions amount for the past 12 months almost determined they will not leave the banking services.
Moreover, John also realized that for similar transactions amount, the loyal customers would tend to have more transactions count. This may indicate that people who have lower transaction count, even though they might have a considerable amount of money spent through their card, are more likely to leave the services.
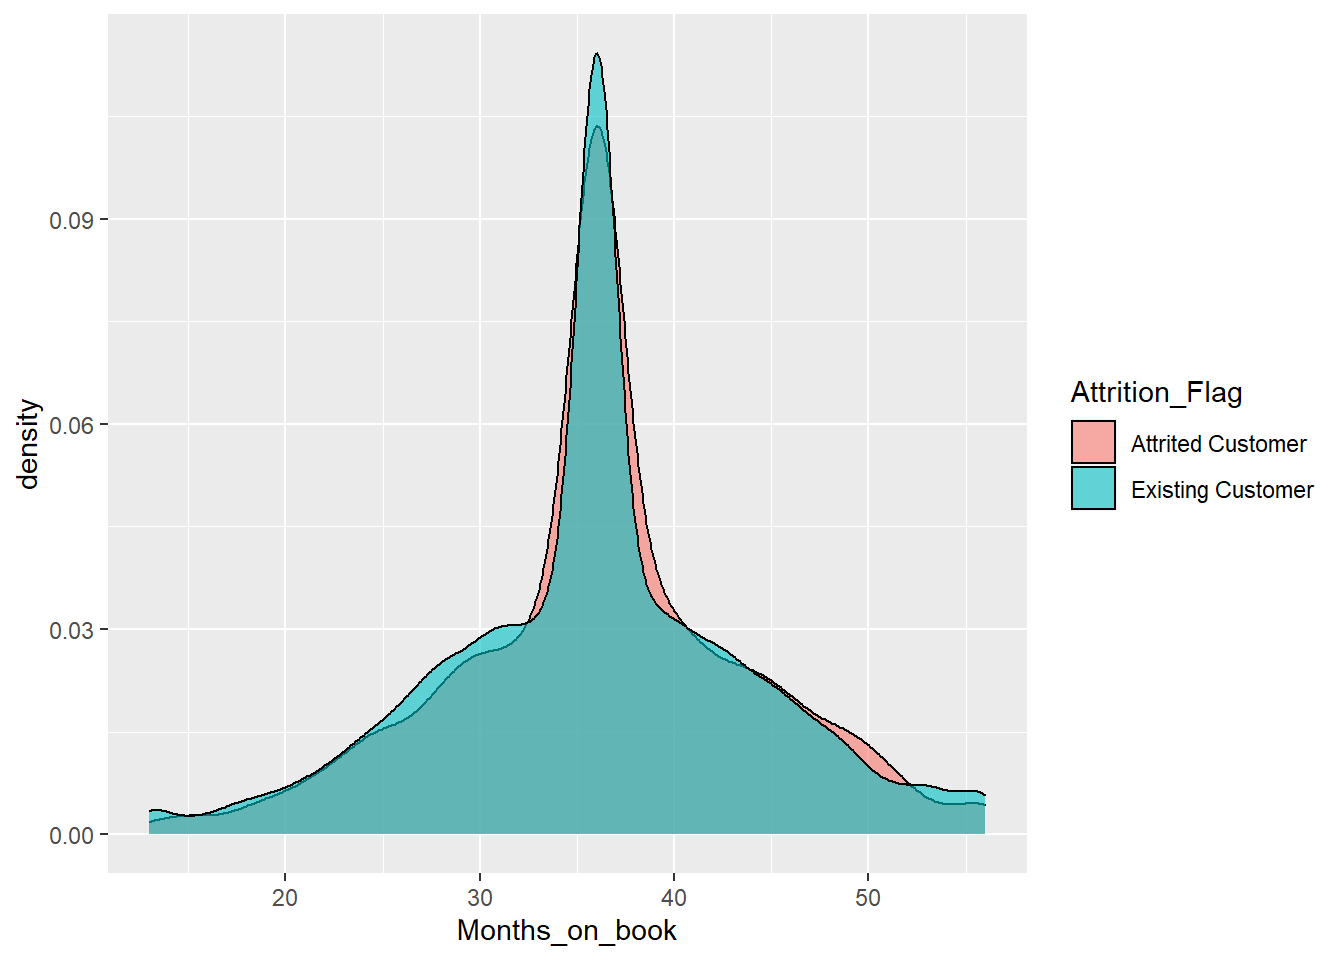
John also wanted to see if he could identify other factors that might influence customers to leave. The bank manager’s experience suggests that the period of relationship with the bank and their open to buy credit line may be a factor. The longer the relationship is, the less likely the customer is to leave; the larger the credit line is open to customers, the less likely they are to leave.
Months on book
Average Open To Buy
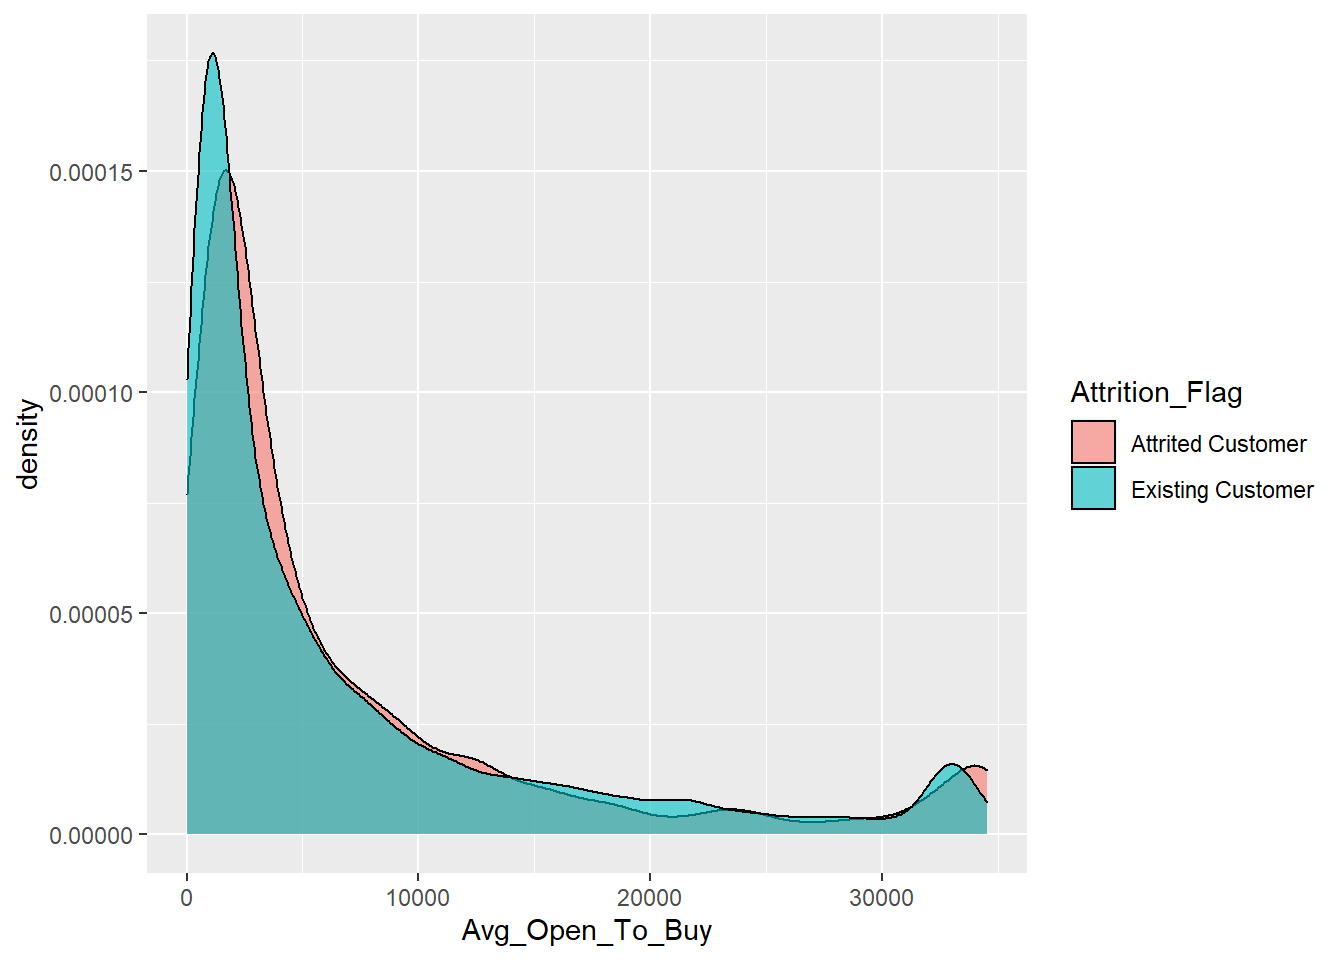 * Contrary to what John thought, from the figure above, there are no obvious differences between the proportion of customer’s churn based on period of relationship with the bank. There’s also no obvious differences between the proportion of customer’s churn based on open to buy credit line. Therefore, months_on_book and avg_open_to_buy are not the influential factor in customer churning.
- Above are some factors that may influence the churning rate.
Conclusion:
John at first thinks that Customer Age, Total transaction count, period of relationship with the bank (months on book), open to buy credit line(Avg_Open_To_Buy), that these factors may affect customer’s choice and churning rate. However, such elements only have no relation or little to do with whether a client will churn or not.
However, this is hardly the case. Under our careful EDA and fitted model, we find out that reasons behind customer churning or to say factors determine why clients leaving the bank can be boiled down to four different elements: total transaction amount, total transaction counts, revolving balance on card and average card utilization rate. In short, the number of times a client uses the card, the amount of money he or she transfers each month and the balance remains on card. After knowing this, we highly recommend Manager John to monitor and pay close attention to his clients’ monthly activities. If a client starts to use his or her card much less times than before, transfer less often or the balance on the card starts to reduce, then this one should be noted. In order to maintain him or her, John can offer phone calls or email services to get in touch with the client more often and offer better services. Let the customer know that the bank cares and values him a lot. By doing so, banks may potentially be able to save customers that’s about to churn and prevent the loss of its revenues.
Interactive component performed by Shiny App:
https://creditsystem.shinyapps.io/FleshDashboard/
- This interactive component is our main interactivity to help us further prove the conclusions from EDA and big picture. This tool is designed by Shiny app. This is a great way for audience to interact with our data if audience are interested in any one of the variables. For each variables, audience could investigate its relationship through select them from the left right group by and Metric function and the relationship would been displayed through bar chart.
- For instance, if we check the relationship between total transaction volume and total transaction cout, we could observe three main customer cluster. This further prove what we achieve in big picture that the most loyal customers are those with more transaction cunt for each transaction amount cluster. Thus, this interactive tool strongly supports some conclusions from our big picture.