
Author: Liangxi Dou, Jialin Guo, Yutong Du and Jiaqi Yin.
Data Link
The credit card market is one of the fastest growing product lines in the personal financial services market. However, more and more customers are leaving credit card services, which makes the bank manager feel uneasy. We want to predict from the dataset that what characteristics do “turned customers” have in common, and then banks can proactively go to the customer to provide them better services and turn customers’ decisions in the opposite direction. Our first dataset is from the Kaggle website, and the author got this dataset from https://leaps.analyttica.com/home. This dataset contains 10,000 customers from banks that consists of their age, salary, credit card limits, current banking status, and other information. Nevertheless, the first dataset has only 16.07% of customers who have churned. Thus, it’s a bit difficult to train our model to predict churning customers, so that we found the second dataset and compared it with the first data set to help us better predict what type of customer is likely to be turned.
Here is the URL for both datasets.
- First Dataset: https://www.kaggle.com/sakshigoyal7/credit-card-customers
- Second Dataset: https://www.kaggle.com/mathchi/churn-for-bank-customers
Variables
The first dataset contains 23 variables. We selected the below 9 variables as our primary interests for EDA and Big Picture:
- Attrition_Flag: Internal event (customer activity) variable (binary: Existing Customer or Attrited Customer)
- Customer_Age: Customer’s age in years (numeric: from 26 to 73)
- Gender: Customer’s gender (binary: F-Female or M-Male)
- Education_Level: Educational Qualification of the account holder (nominal: College, Doctorate, Graduate, High School, Post-Graduate, Uneducated or Unknown)
- Income_Category: Annual Income Category of the account holder (nominal: Less than 40K-60K-80K-120K+)
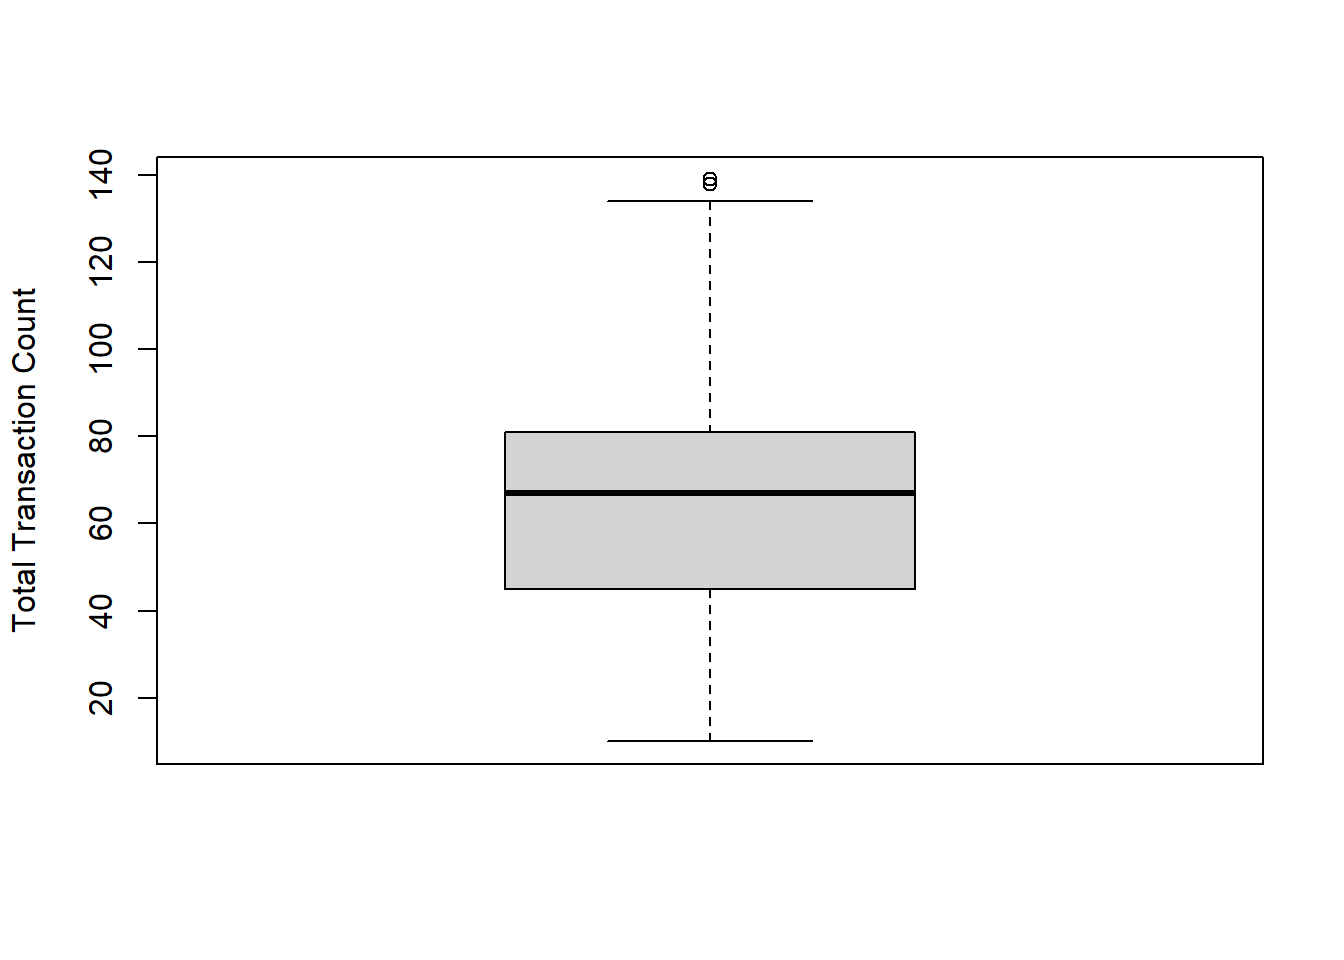
- Total_Trans_Ct: Total Transaction Count (Last 12 months) (numeric: from 10 to 139)
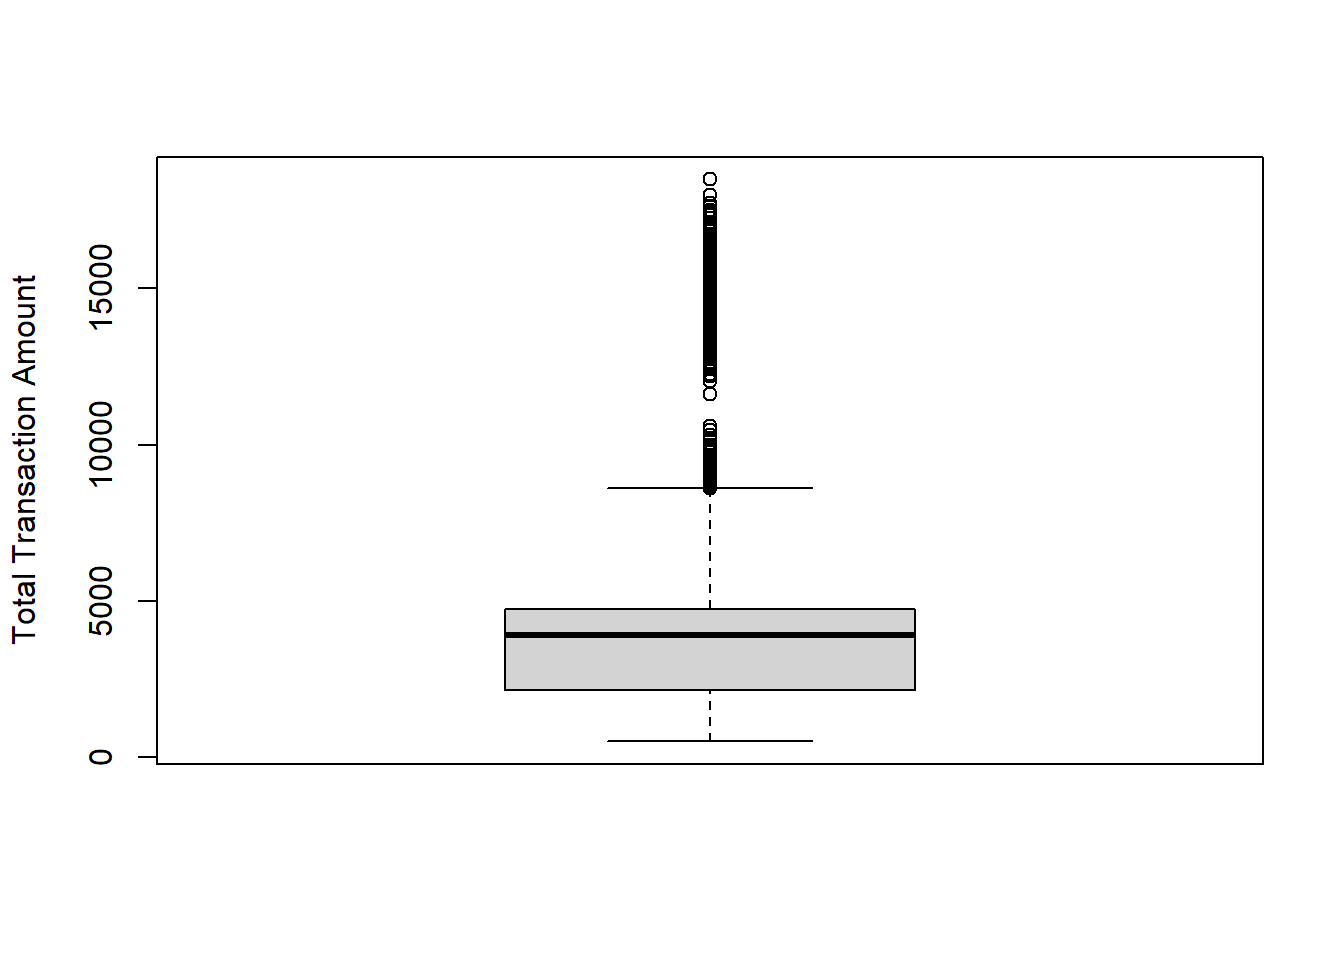
- Total_Trans_Amt: Total Transaction Amount (Last 12 months) (numeric: from 510 to 18484)
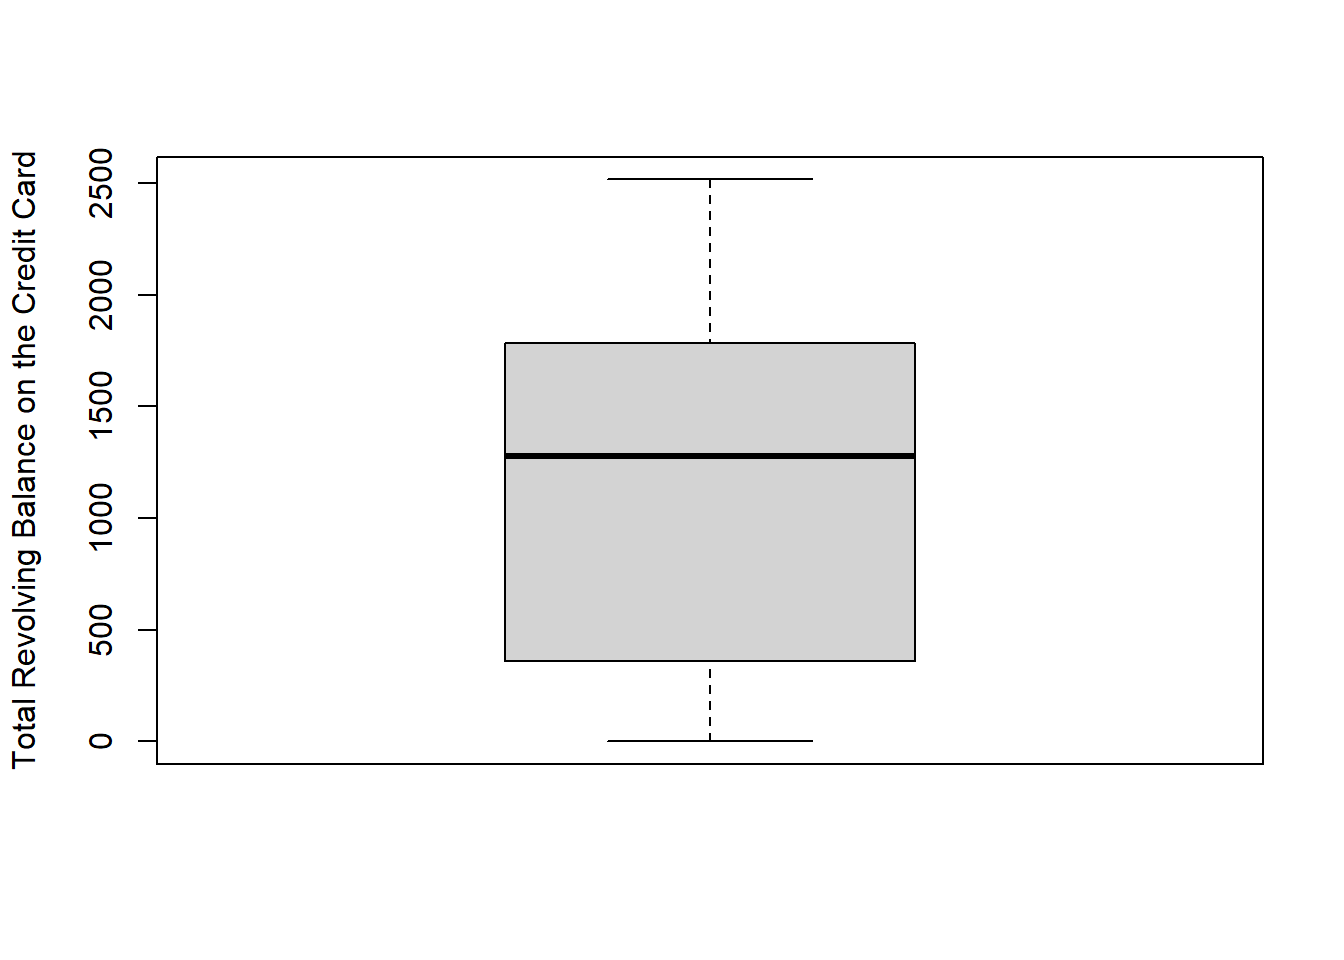
- Total_Revolving_Bal: Total Revolving Balance on the Credit Card (numeric: from 0 to 2517)
- Avg_Utilization_Ratio: Average Card Utilization Ratio (numeric: from 0 to 1)
The second dataset contains 14 variables. We selected the common ones shared in the two datasets:
- Exited: whether or not the customer left the bank (binary: 1-left or 0-not left)
- Age: Customer’s age in years (numeric: from 18 to 92)
- Gender: Customer’s gender (binary: Female or Male)
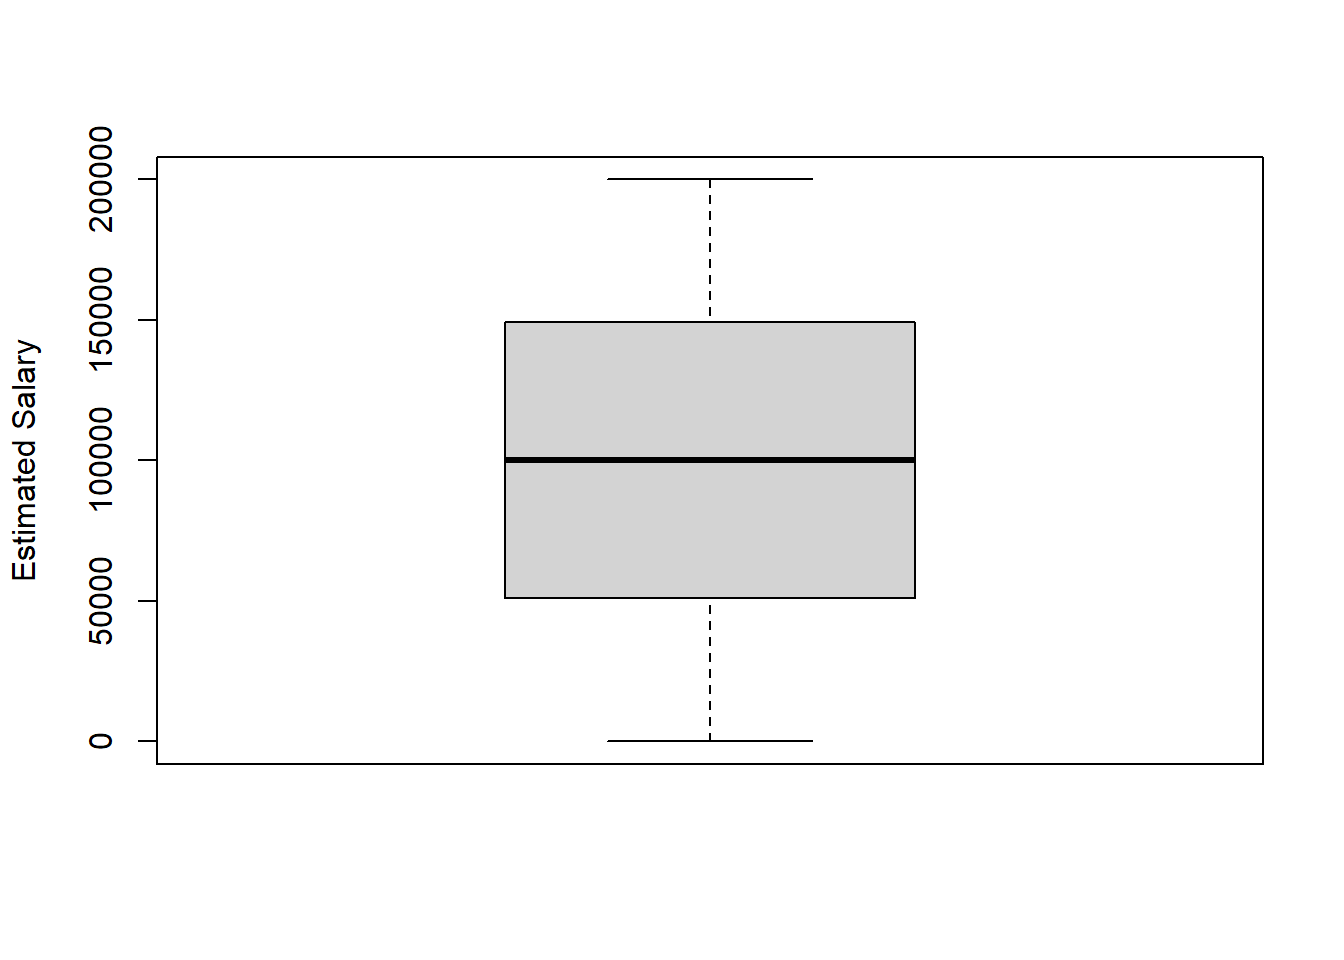
- EstimatedSalary: Estimated customer salaries (numeric: from 11.58 to 200k)
Data Import & Cleaning
We first import two datasets and check importing issues by using the function problems.
## [1] row      col      expected actual
## <0 rows> (or 0-length row.names)## [1] row col expected actual
## <0 rows> (or 0-length row.names)Then we detect the missing values and outlier. From boxplots, we realized that variables “Cusomer_Age”, “Total_Trans_Ct”, “Total_Trans_Amt” in dataset 1 and “Age” in dataset 2 have outliers. We removed the outliers which are defined by the IQR method.
## [1] 0## [1] 0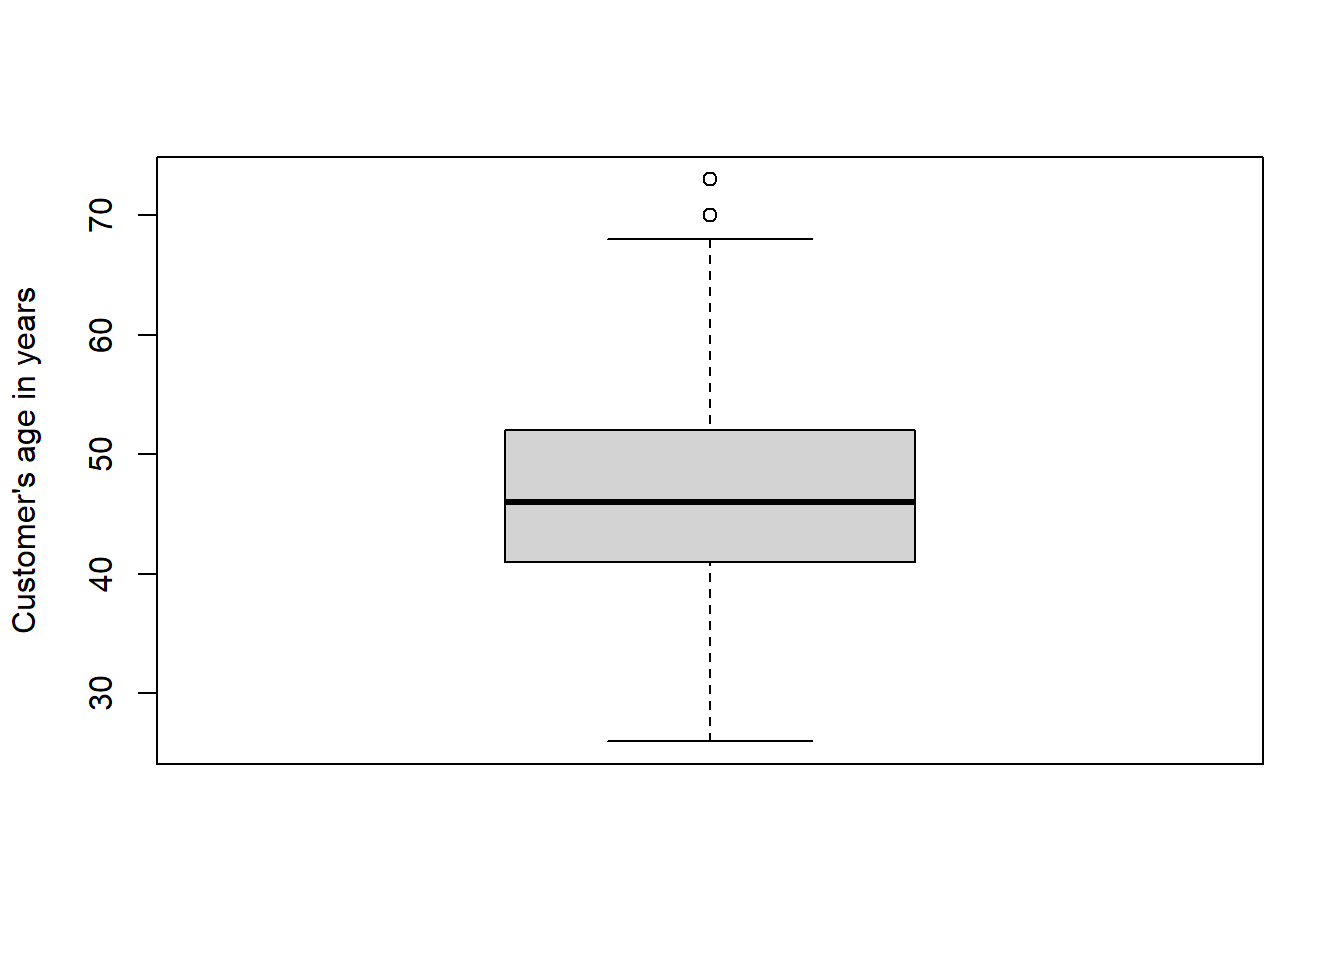

This link direct you to the detailed data cleaning process. load_and_clean_data.R